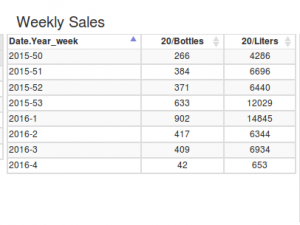
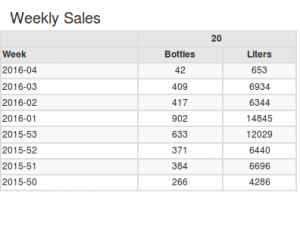
A sortable table component with weekly statistics sounds quite easy. However….
Information need
A customer of Susteq wants to sell water jerry cans of 1, 5 and 20 liters. They like to know the weekly sales for each of this jerry cans (number of jerry cans and total amount of water). A table component would be a good instrument to visualize this data, with the sales of the past X weeks.
Problems
- To be able to sort the data per week, the datum should have
 a format like 2016-08. But the Mondrian query could not return this, because of the use of currentDateMember and the Visual Basic formatting only implements week number without leading zero.
 - When does week number 1 starts?
- In a period (or for certain water sales units) not all different jerry cans are sold, so the number of columns varies so different number of columns
- No hierarchy in table header, default row headers look like 1/Bottles, 1/Liters, 5 Bottles, 5 Liters,20/Bottles, 20/Liters
Solution
Database and query (1,2)
In the database/datamodel is a date dimension with two fields containing year and week. Both are of type integer. These are used as level in the hierarchy. We also have an string column year-week with leading zero. We use this field as ordinalColumn at the week level (unfortunately we could not use this field as caption column to display to the user, since it is not implemented yet in cde. To fill the database we used the ISO8601 calculation of week and YEAR. Thanks to Diethard, we could know query the data with something like:
SELECT NON EMPTY CrossJoin([~COLUMNS], {[Measures].[Bottles], [Measures].[Liters]}) ON COLUMNS,
NON EMPTY LastPeriods(${param_period}, CurrentDateMember([Date], ‘${param_date}’))
ON ROWS
With $param_date: [“Date.Year_week”]\.[yyyy]\.[ww]
Adjusting week number string (2)
To add the leading zero we define the type of first column (with the week number) as formattedText and add the leading zero if it has a length of 9 (or less)
  //week number with leading zero
    this.setAddInOptions("colType","formattedText",function(cell_data){
        var tempCell= cell_data.value;
        var tempDate=tempCell.split("-");
        if(tempDate[1] <=9){
            return {  textFormat: function(v, st) { return tempDate[0]+"-0"+tempDate[1]; } };
        }
         else {
            return { textFormat: function(v, st) { return tempDate[0]+"-"+tempdate[1]; }  };
            }
      });
Different number of table columns (3)
To solve the dynamic number of columns we add some javascript code as pre-execution script as suggested on the pentaho forum:
//reset col headers
    this.chartDefinition.colHeaders = [];
    //this.chartDefinition.colTypes = [];
    this.chartDefinition.colFormats = [];
 It is not necessary to reset the colTypes and we need it for the columnHeaders adjustment. This solution has a disadvantage: when there is no data, it returns an “Error processing component”, caused by this.chartDefinition.colHeaders. I have not yet found a solution for this problem.
Sub columns/ hierarchy in column headers (4)
Again based on a post at the Pentaho forum, we add some javascript code as postExecution script to add a table header row which contains the group label (1, 5, 20) and changed the existent header row to remove this group label):
function() {
    var nrcol=2; //number of columns in the group (Bottles and Liters)
    var firstHeader="Week";
    var thpart = "";
    var cells = $( "#" + this.htmlObject + " thead th " );
    cells.each(function(i, v) {
        if( i > 0 ) { //skip the first cell of each row
            var cell = $( v );
            var originalText = cell.text();
            var originalTextParts = originalText.split( "/" );
            if (i%nrcol==0){
                thpart=thpart+"<th class=\"thspan\" colspan='"+nrcol+"'>"+ originalTextParts[0]+"</th>" ;
            }
            cell.text( originalTextParts[1] );
        } else {
            var cell = $( v );
            cell.text(firstHeader);
        }
    });
     var newHeaderRow = "<tr><th></th>"+thpart+"</tr>";
    $( "#" + this.htmlObject + " thead" ).prepend( newHeaderRow );

    //add some style...
    $( "#" + this.htmlObject + " thead th" ).css( "border", "1px solid #DEDEDE" ).css( "background", "#E6E6E6" );

}
